Fractals are undeniably beautiful. The self-similar, highly complex patterns reflect elements of the natural world, yet appear geometric and almost alien in their organisation. I decided to generate some using python and tensorflow as a short mini-project. There are a tonne of resources online for generating fractals in any programming language – I made particular use of this GitHub repo by hzy46, this blog over on IBM and this reddit post for colouring – so this a relatively quick exercise, but rewarding! You can find all the code I wrote for this exercise over on GitHub – check out the Jupyter notebooks there for examples and explanations.
The two most famous fractals are the Mandelbrot set and the Julia set. My algorithm for producing either set first requires defining a complex matrix (the “grid”) on which to operate. Then we can use tensorflow to perform the Mandelbrot/Julia algorithm. Tensorflow’s matrix algebra provides an easy method for fast computation of the fractals with built-in hardware acceleration, a useful feature for our fractals, which repeat the same operation many times on every cell in the matrix. With our grid, plus “threshold” and “iterations” parameters, the Mandelbrot algorithm is:
# Define the tensorflow variables
c = tf.constant(grid.astype(np.complex64))
z = tf.Variable(c)
n = tf.Variable(tf.zeros_like(c, tf.float32))
# Start the tensorflow session
with tf.Session():
    tf.global_variables_initializer().run()
    # Define the main mandelbrot algorithm - either take the square plus x, or keep z
    z_out = tf.where(tf.abs(z) < threshold, z ** 2 + c, z)
    not_diverged = tf.abs(z_out) < threshold
    # Create a group of tensorflow operations
    step = tf.group(
        z.assign(z_out),
        n.assign_add(tf.cast(not_diverged, tf.float32)))
    # Run the operations for a set number of steps
    for i in range(iterations):
        step.run()
We now have filled our grid with complex values from the algorithm. For colouring the cells according to their complex value, we define a few options:
- If the absolute value of the cell is below some minimum threshold, we display the background colour (black by default).
- Otherwise, a function maps complex values to (logarithmic) real values so that we can colour them.
- Depending on the final value, we then have two sets of ratios of RBG colour – one for the overall background, and one for the highlights on the edges of the complex fractal structure.
With this all together, we use the following code for each cell, where the threshold and colour ratios (r1, r2, r3, b1, b2 and b3) are globally defined.
def colour(z, i):
    """
    Gets the colour of a z and step value.

    :param z: the z value from the mandelbrot set
    :param i: the step value

    :rtype: list
    :return: list containing the RGB colours
    """
    if abs(z) < threshold:
        return 0, 0, 0
    v = np.log2(i + threshold - np.log2(np.log2(abs(z)))) / threshold
    if v < 1.0:
        return v ** b1, v ** b2, v ** b3 # coloured tones
    else:
        v = max(0, 2 - v)
        return v ** r1, v ** r2, v ** r3  # sepia tones
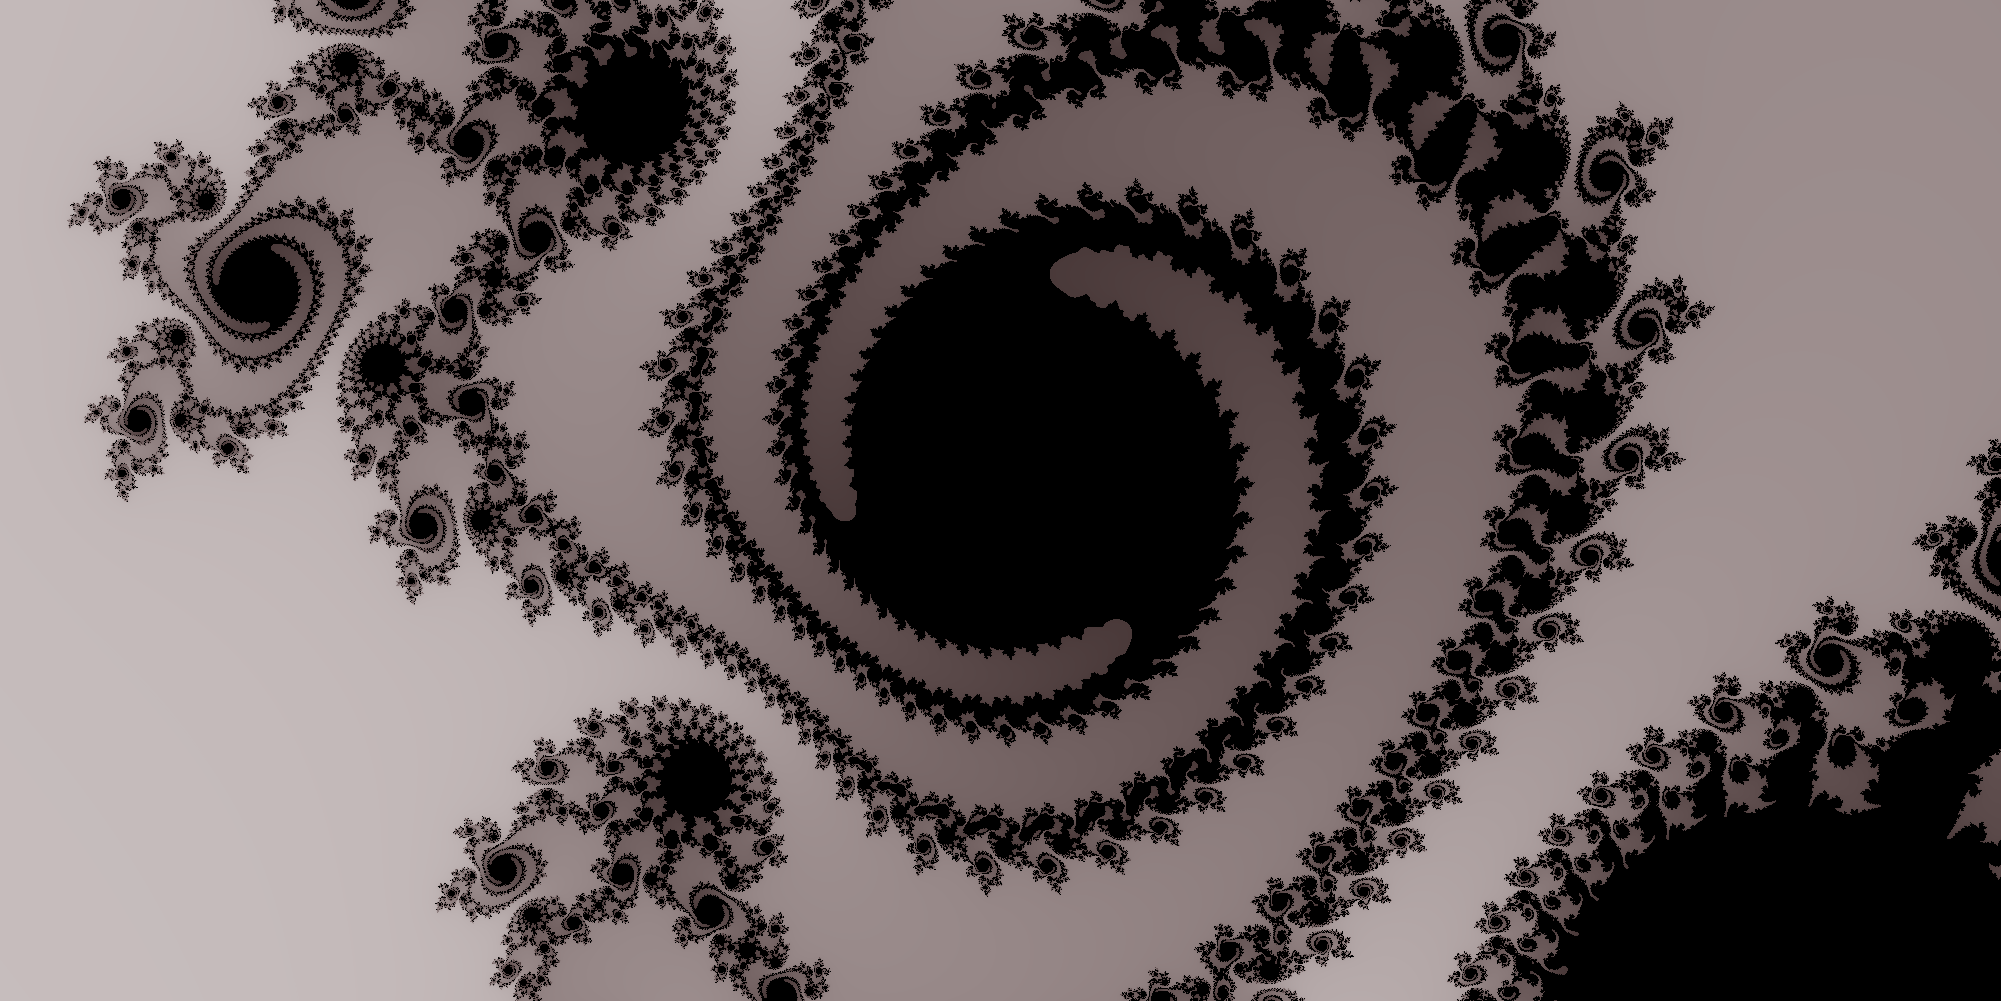
Now we can experiment with different colouring for some better-looking fractals.
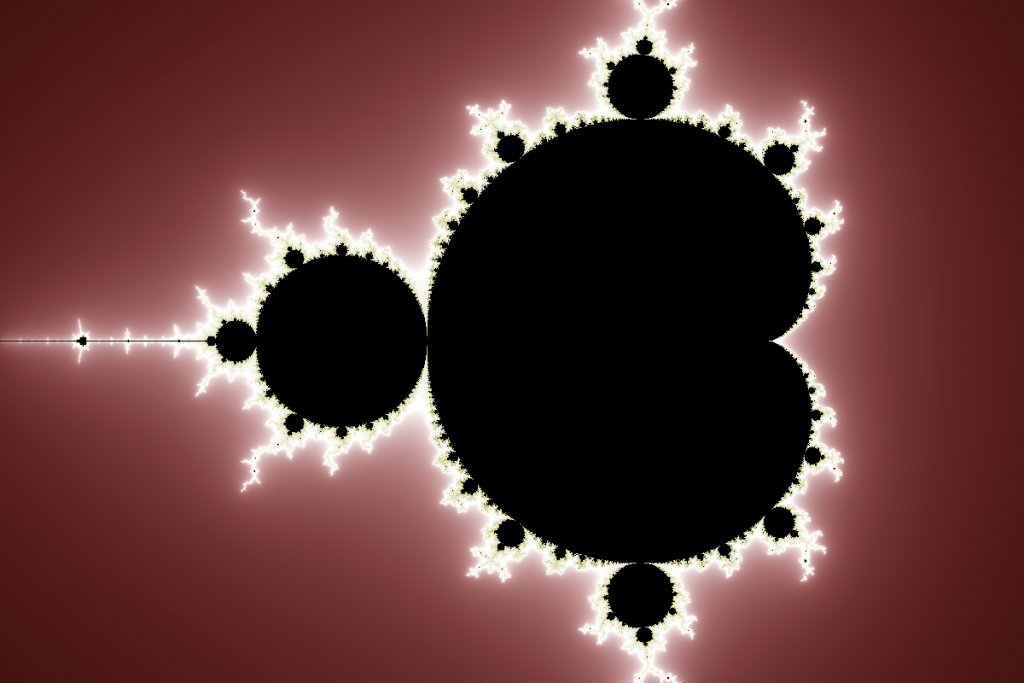


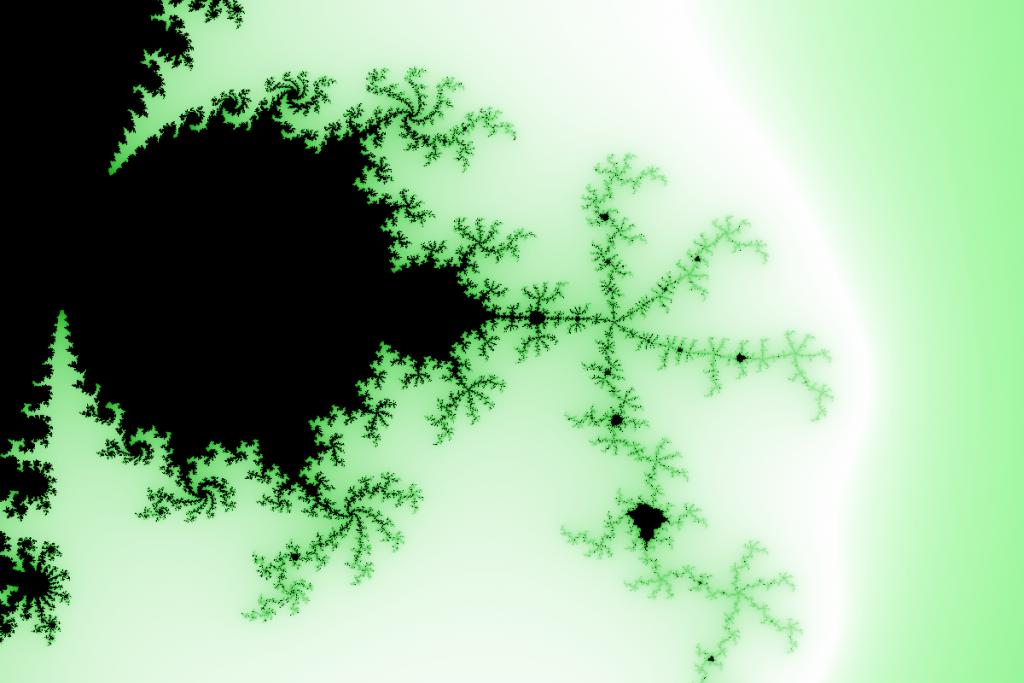
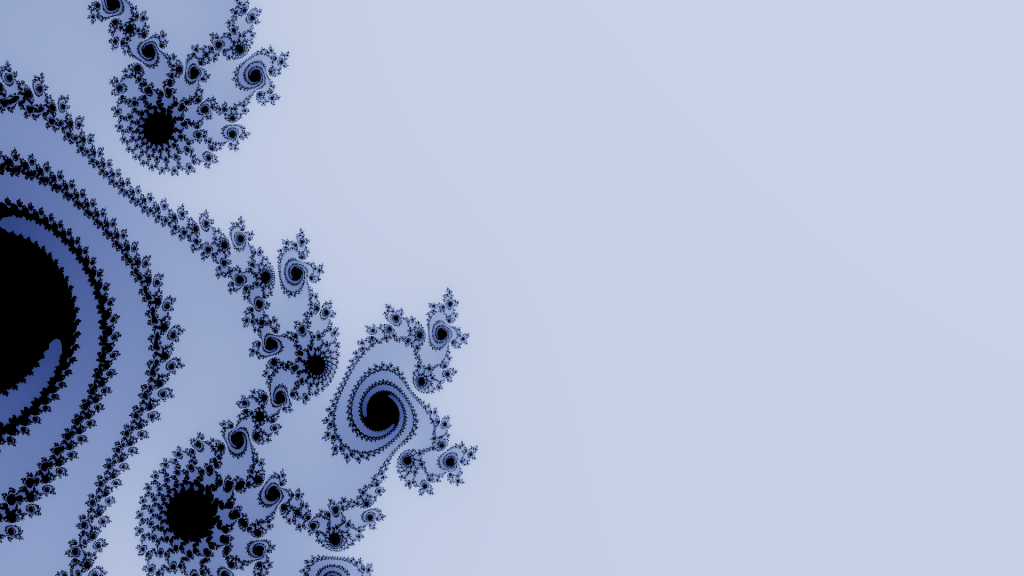
Or explore different areas of the fractal.




And now theJulia set.
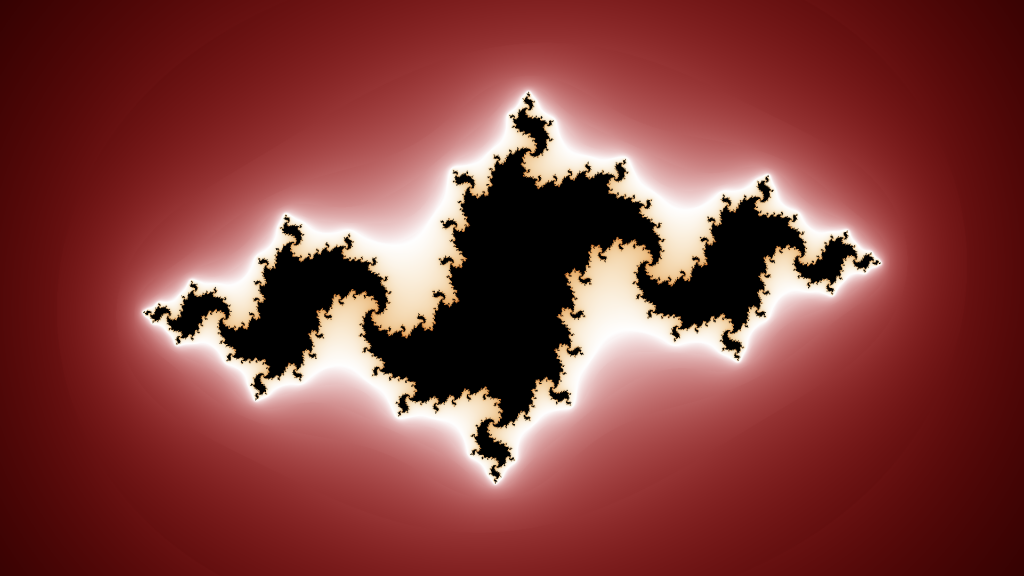


The Julia set has a periodicity. For some \(\theta\), we have
\(c=-(a-r cos(\theta)) – (b + r sin(\theta))i\)
where \(a\) and \(b\) are constants defining the initial shape and \(r\) defines the amount of variation over a single period. Using this periodic formula on \(\theta\), and therefore on \(c\), we can produce an animation of the Julia set.


Cool, right? I’d recommend writing your own fractal generator and trying to generate some fractal art for yourself.
One thought on “Programming fractal art using tensorflow”